MarketBalance Indicator for NinjaTrader
1. Overview
The MarketBalance indicator is the second major ‘market view’ indicator written by Final for the NinjaTrader environment. The first, (TPO Chart) offers a complete Market Profile view and has been adopted by many NinjaTrader users interested in applying this well known approach to their trading.
With the addition of MarketBalance, NinjaTrader users now have access to a comprehensive set of ‘views’ for Bid/Ask and volume at price analysis. It can be used on any version of NinjaTrader on any instruments for which intraday Bid/Ask price and volume information is available.
MarketBalance can be applied to any intraday interval setting for NinjaTrader chart types Tick, Volume and Minute.
2. Features Overview
MarketBalance incorporates the following;
Volume at price views;
Bid/Ask
Bid/Ask Ladder
Delta
Graduated Volume
Delta Colored Volume
High/Low Volume
Volume Histogram
Totals (per bar)
Ask
Bid
Delta
Max Delta
Min Delta
Cumulative Delta
Cumulative Delta/Cumulative Volume %
Volume
Cumulative Volume
Totals (per price per session)
Volume
Bid/Ask Histogram
Price Ladder
Candle Body
- Highlights Open/Close of overall bar
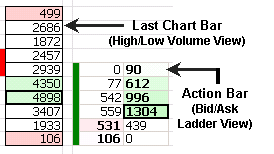
Action Bar
- A bar which operates independently bar to the right of the current bar to portray immediate price action in two ways in any of the MarketBalance views
Delta Calculation Type by
Bid/Ask
UpTick/DownTick
Trading
- Integrates with Chart Trader al owing direct trading from a MarketBalance chart for Live Trading Versions of NinjaTrader (on any symbol that has ful Bid/Ask price and volume data available) More detail is provided in Features Description below.
3. Installation, Trial, Subscription
MarketBalance is available for a 14 day free trial. It can be downloaded from this link
Once the download is complete ensure NinjaTrader is closed.
Double click on MarketBalance_setup.exe and fol ow the prompts.
When the instal ation has completed, restart NinjaTrader and check that ‘Market Balance’ appears at or near the top of the Indicators list.
During the trial a Licence dialog popup will appear to facilitate subscription.
Subscription requires the Machine ID which can be copied from NinjaTrader; Control Center > Help > About. The Machine ID is on the third line.
4. Important Note
MarketBalance operates within the real-time NinjaTrader environment.
NinjaTrader does not save price Bid/Ask volume data to its database, therefore this history is not accessible for MarketBalance to load. So, MarketBalance
also functions on real-time data and does not plot any values for historical data. Data will only be captured within MarketBalance when NinjaTrader is open and connected to a real-time feed.
This also means that if any chart interval or indicator parameter (except as mentioned below in 6. Features > Selection Methods) is changed, then any accumulated real-time plots wil be lost. It is suggested, that after experimentation to get the desired MarketBalance parameter setup, a template is saved.
5. History - Future
Sometime soon after the next major release of Ninjatrader (v6.5), scheduled for late fal 2007, it may be possible that MarketBalance wil offer limited re-loadable History based on a modified use of the Market Replay Recorder facility.
6. Features Description
Here are descriptions of the main MarketBalance features.
Delta Calculation
Delta is defined as the difference between the Buying volume and the Selling volume.
There are two ways it can be calculated:
Bid/Ask – Delta can be calculated based on trades occurring at Bid or Ask, as fol ows:
If trade at Ask then trade direction is up & Volume = Buy.
If trade at Bid then trade direction is down & Volume = Sel .
Up Tick/Down Tick - Delta can be calculated based on price continuing to tick up or down, as fol ows:
If Ask > Last Ask then trade direction is up & Volume = Buy.
If Bid < Last Bid then trade direction is down & Volume = Sel Else Volume = last trade direction.
Action Bar
The Action Bar is an optional bar that can be displayed to the right of the last normal chart bar and that can be run by a set of rules independently from the main MarketBalance Bars of the chart.
It can be displayed in any of the MarketBalance Views as described below. .
It has two rule sets that are unique to it, as follows:
Pullback – in Pull back mode, the Action Bar is reset every time the current MarketBalance bar makes a new high or low. If price continues to tick lower the Action Bar wil be reset at each new low. Then as price moves off the low, the Action Bar wil build, so showing the conviction of buyers to drive price away from the low. In this scenario, the Action Bar wil continue to build until:
The low is broken again
A new (bar) high is made
Or a new bar is started on the chart
Any of these events wil cause the Action Bar to be reset.
Continuation Bar – in Continuation mode, the Action Bar wil display the last x price levels (default of 5) independently of the current MarketBalance bar. It wil maintain a constant number of price levels, so if price is ticking up, the Action Bar wil move up to the new high and its previous lowest price wil be dropped. Thus the Action Bar wil ‘slide’ up and down the current bar showing the immediate volume at each level of price action.
The Action Bar wil continue to build until:
Price ticks above its current high, when its lowest price will be dropped.
Price ticks below its current low, then its highest price wil be dropped.
In Continuation mode the Action Bar will not be reset with each new MarketBalance bar.
Because it does not reset with each new bar, it is possible to use this mode of the Action Bar to capture longer term Accumulation or Distribution. By changing the default setting for say ES, to 12 (3 points) a much clearer view of what is happening during periods of consolidation can be gained.
In situations where price might be rotating in a fairly narrow range a setting ES of 12 (or larger if preferred) for ES as an example, can show in a single bar that might cover 2 - 3 hours, what the building market condition is. That in turn may communicate what the likely breakout direction could be.
Experiment with settings using either live data or Market Replay to gain an understanding of larger Continuation Bar setting may be used.
MarketBalance Views
There are 7 different ways to View the MarketBalance bar. In each View, individual prices are color graduated based on either higher or lower volume or delta;
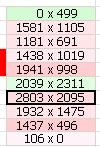
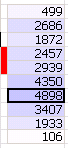
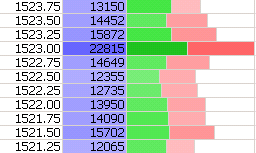
Bid x Ask – displays the trades occurring at the Bid and Ask at each price point within the MarketBalance bar. The Highest Volume price has a heavier box outline.
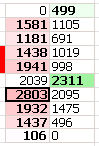
Bid/Ask Ladder – displays to the Bid x Ask except more compact and where the side that has the Highest Volume is colored and bolded to highlight it to al ow for quick visual identification of directional price runs. The Highest Volume price has a heavier box outline on either the Bid or Ask side of the ladder.
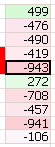
Delta – displays the net of Sel – Buy volume transactions at each price. The Highest Delta price has a heavier box outline.
Graduated Volume – displays the volume at each price color graduated to al ow for easy visual differentiation lower and higher volume prices. The Highest Volume price has a heavier box outline.
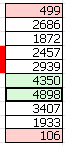
Delta Colored Volume – displays the volume at each price colored graduated by higher or lower Delta. The Highest Volume price has a heavier box outline.
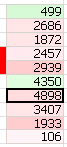
High/Low Volume – displays the volume at each price with just the regions of high(er) and low(er) volume colored. The Highest Volume price has a heavier box outline.
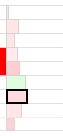
Volume Histogram – displays the volume at each price as a Histogram with coloring graduated by higher or lower Delta. The Highest Volume price has a heavier box outline.
Highest Volume Highlight
For every Action Bar and MarketBalance bar, regardless of View, the price with the highest volume (or delta for the Delta view) is highlighted with a heavier surround box.
Information Totals
There are two sets of totals displays available within MarketBalance, on the left side and at the bottom of the chart.
Left Side – has 3 elements
Price ladder
Volume total at each price level
Volume Histogram with volume at Ask and Bid color splits
Any combination or al of these can be displayed.
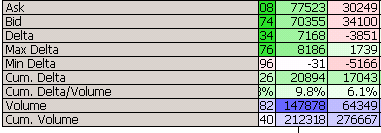
Bottom – has 9 elements and displays totals for each MarketBalance Bar * Ask – total Ask Volume in the bar.
Bid – total Bid Volume in the bar.
Delta – the difference between Ask and Bid volume.
Max Delta – the maximum Delta reached within the bar.
Min Delta – the minimum Delta reached within the bar.
Cum Delta – the accumulation of Delta across the session (as set by either Chart properties or within Parameters > Session Times).
Cum Delta/Cum Volume – a percentage of the overal Delta across the session.
Volume – the total volume within the bar.
Cum Volume – the accumulation of volume across the session.
Any combination or al of these can be displayed. Al but Max and Min Delta are also displayed for the Action Bar.
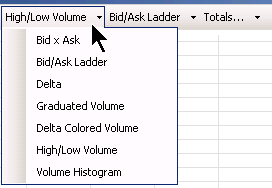
Selection Methods
There 3 ways available to select Action Bar and MarketBalance View type and the Information Totals;
Parameters – normal y these would be used to set up the preferred default views, then saved as a template. Note that changing any indicator parameter wil refresh the chart and all accumulated Bid/Ask data will be lost.
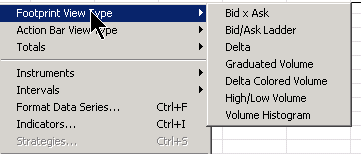
Dropdown Menus – 3 menus have been added to the toolbar, the first and second al ows View Type selection for the MarketBalance and Actions bars respectively, while the last al ows tick box selection of any or al of the Totals. Note that changing any View or Totals option via the Dropdown menus does not refresh the chart and so accumulated Bid/Ask data is not lost.
Right Click Chart Context menu – once done three options, MarketBalance View Type, Action Bar View Type and Totals will be seen at the top of the menu list.
Note that changing any View or Totals option via the Context menu does not refresh the chart and so accumulated Bid/Ask data is not lost.
Note that with either of the second two methods changing the MarketBalance View will automaticaly change the Action Bar View as well. Then use the Action Bar menus if a different view is wanted for it.
MarketBalance Parameters
Once the MarketBalance has been installed, open a new NinjaTrader chart and select MarketBalance from the Indicator list. It wil appear as MarketBalance at or near the top of the Indicators List.
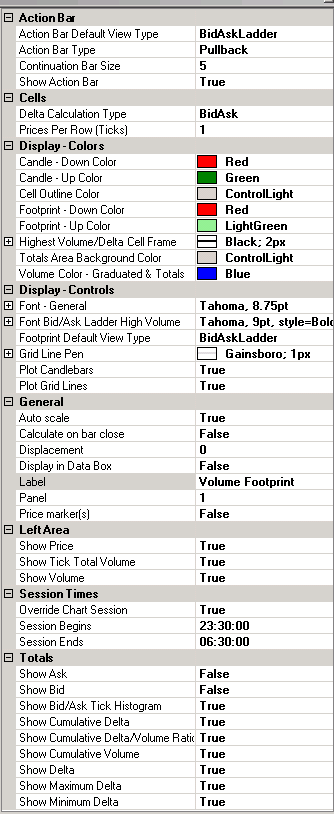
Below, the selections under Parameters are (where required) described.
Action Bar
Used to set Action Bar Parameters;
Action Bar Default View – sets the Action Bar default View.
Action Bar Type – sets the Action Bar to either Pul back or Continuation.
Continuation Bar Size – sets the Action Bar height in ticks (Continuation mode only) Show Action Bar – set to false to disable the bar.
Cells
Used to select Delta calculation type and Prices per row;
Delta Calculation – sets the way Delta is calculated (refer to Features Description above).
Prices Per Row – this would normal y be left at 1, however, if a Symbol has an extremely large range, increase the Prices per row to condense it.
Display – Colors
These are self-explanatory.
Display – Controls
These are self-explanatory.
General
Standard NinjaTrader inclusions.
Left Area
Used to select which of left side chart Totals are displayed as defaults.
Session Times
Used (only) to control when the Totals fields reset to begin a new session. The parameter can be used for any symbol that has trading which extends either side of its main session, or has session times that cross a date.
Note this parameter does not override the Session Begins/Ends settings within Chart Properties, nor does it control the bars shown on a chart.
Totals
Used to select which of the bottom of chart Totals are set as defaults.
Once all parameters have been set it is suggested that these are saved as a Template for easy application to other charts.
Support
Any support issues and problem reporting can be sent to financial.algorithms@gmail.com
with MarketBalance in the subject line.
Education
The Institute Of Auction Market Theory provides trading and training room specialising in Market Profile and Volume At Price interpretation and application.
There is also a link on the site to sign up for a free daily market recap for the e-mini S&P 500, which Institute founder Bil Duryea comprehensively describes the days action in Auction Market Theory terms.